MeetBaeArea
End-to-end analytics project of Meetup.com data
Objective
The primary objective of this project was to gain a deeper understanding of data engineering concepts and tools. This was achieved through building an ETL data pipeline. The frontend was added to better appreciate the backend work required for even the simplest of data explorations.
View the dashboard here
Technical Overview
 Pipeline visualized
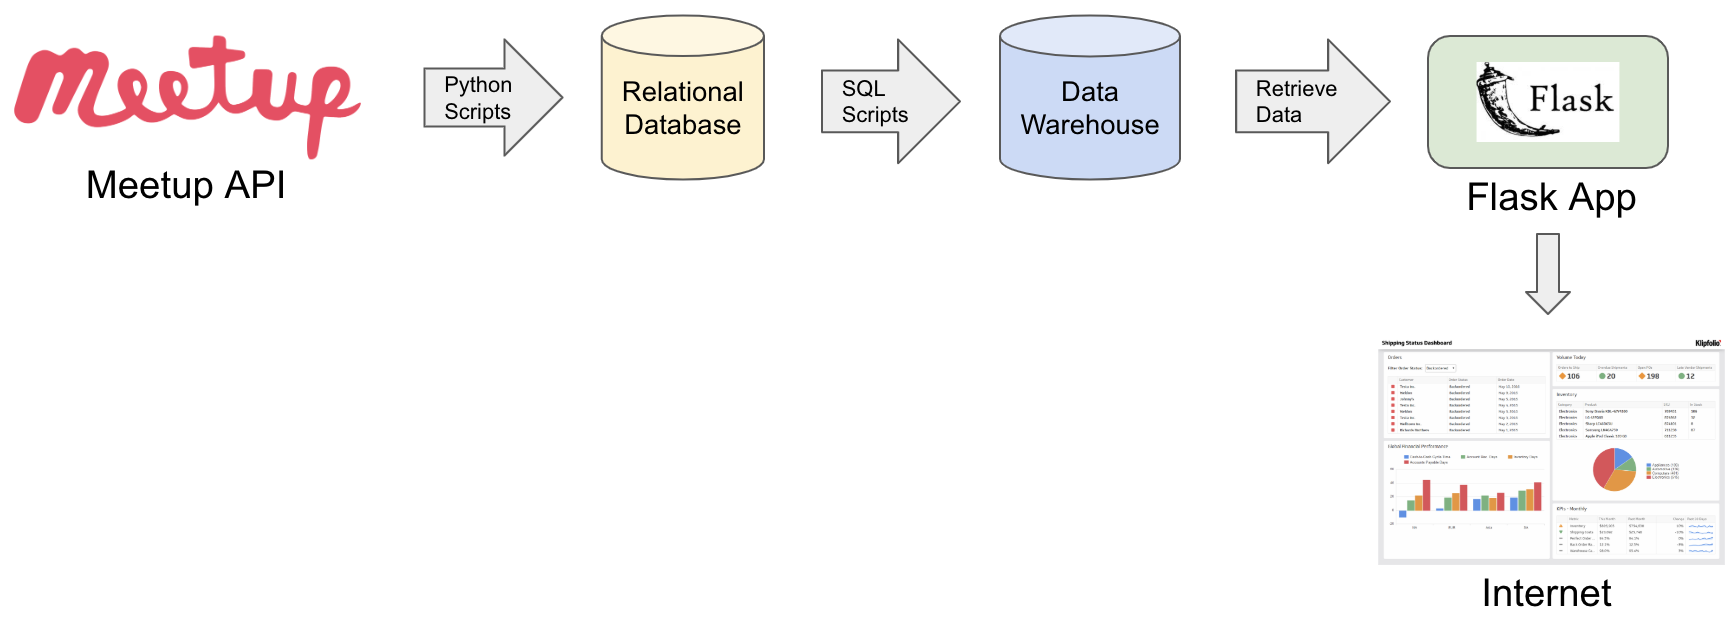
Steps in the Data Pipeline:
- Python scripts retrieve data from Meetup via their API and stores the data in a relational Postgres database.
- SQL scripts then transform the data into a star schema for reporting, and then loads the data into a data warehouse.
- A Flask app (in this case, Github pages) is used to retrieve the data from the warehouse and then visualize it using D3.js
At a very high level, these steps are what most data pipelines boil down to: Extract relational data, Transform the data for reporting, Load the data into a warehouse. While simple conceptually, the details and complexities that each step brings is enough to make companies hire data engineers. One amazing tool that allows engineers to manage their data pipelines is…
Airflow
Airflow
was developed by Airbnb to manage their own internal pipelines. The library is written in Python and the Apache Software Foundation is incubating it so the code will be well-maintained. Setup is minimal and intuitive which lessens the learning curve.
In the simplest words, Airflow will schedule and run the above 3 data pipeline steps. To better help you understand what Airflow did for this project, here is a screenshot of the UI Airflow provides:
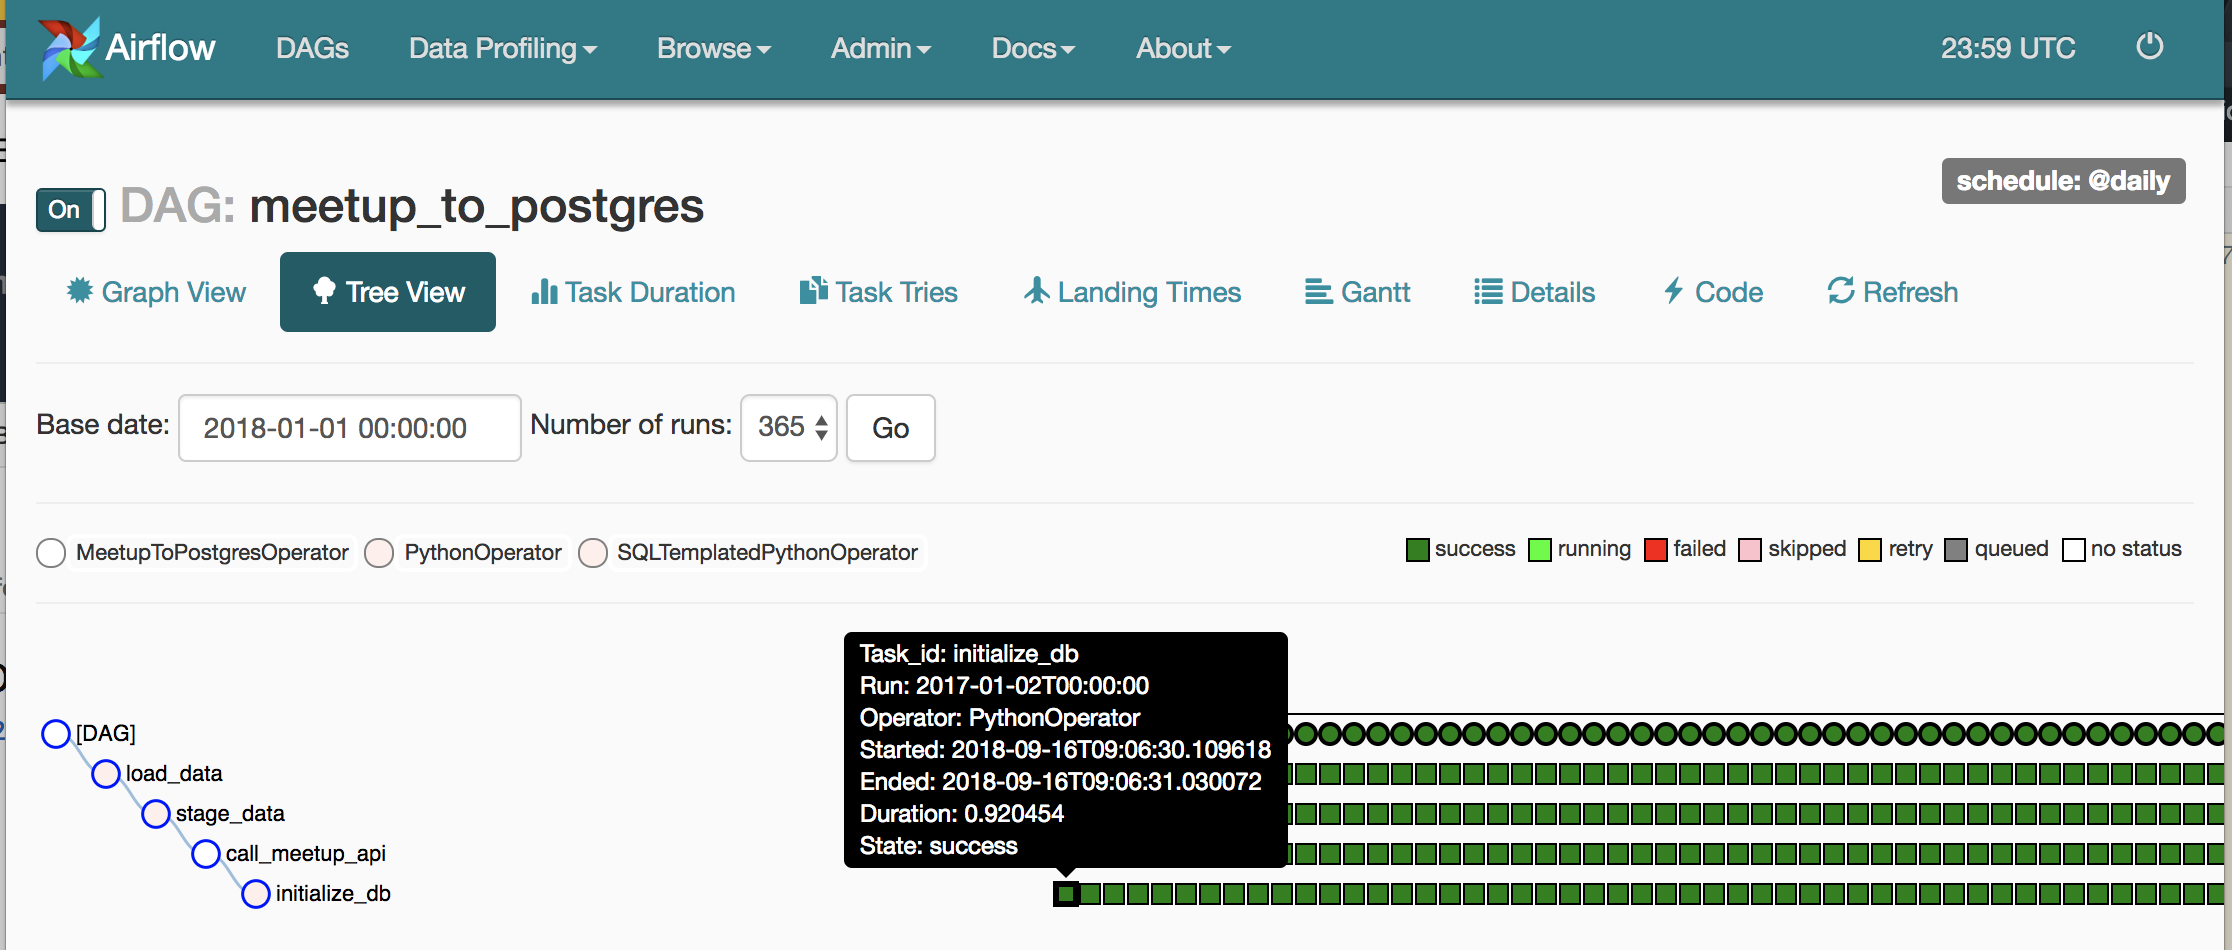
My Airflow UI showing me my data pipeline is healthy :)
My data pipeline (A.K.A. DAG) is called “meetup_to_postgres” and there are 4 steps the pipeline does indicated by the circles:
- initialize_db
- call_meetup_api
- stage_data
- load_data
The green boxes indicate a scheduled run (daily) of the pipeline and if the steps ran successfully. The black tooltip shows an example of Airflow running these steps for a historical backfill on January 2nd, 2017. I was able to succesfully backfill the data all the way back to 2008 in ~4 days!
Docker
Lastly, I need to mention Docker which I used to deploy my app to AWS.
Learning how to deploy an application outside of your own laptop is a daunting task for the inexperienced, but Docker provides a robust solution for this. I won’t explain the details, but for this project, I used Docker to create 3 containers to run the Airflow scheduler, Airflow webserver, and a Postgres database for Airflow to store metadata.
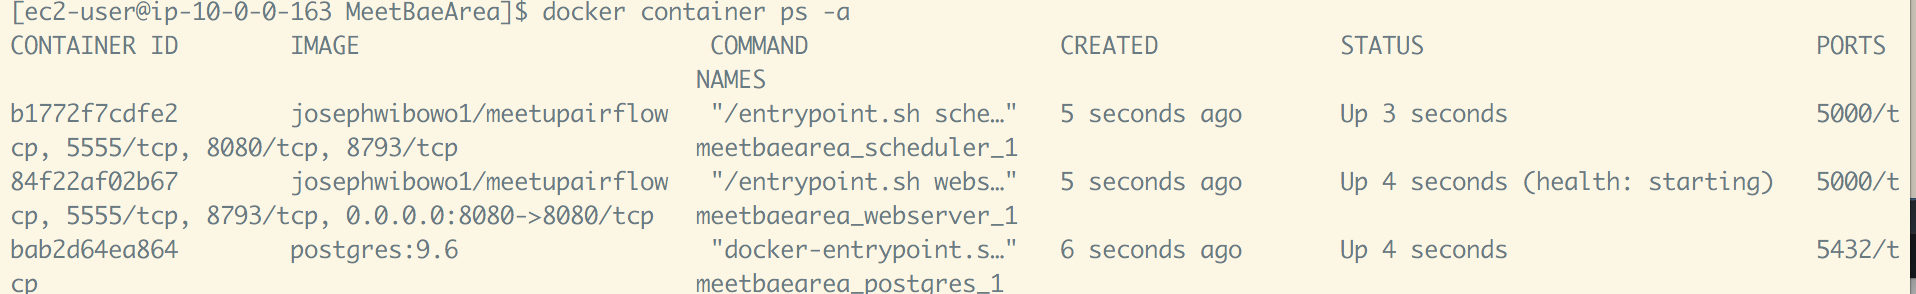
My project's Docker containers running on an AWS EC2 instance
The config files to create those containers were uploaded to Docker’s website (similar to github) and then pulled into an AWS EC2 instance. After running a few commands in the terminal, those containers I developed locally are now running on an EC2 instance in the cloud. This just touches the surface of how Docker can be used, so I recommend learning about it if this sounds useful to you.
The Process
0) Finding a data API
I included this step because the data is the most important part of the project. Find data you are genuinely interested in and the motivation to complete the project will greatly increase. I chose the Meetup API because I am interested in exploring human behavior. Here is a list of other data APIs.
After you find the data, start asking questions. For me, the question I wanted to answer was “what does the dating scene look like on Meetup for the bay area?”
1) Retrieving the data
The Meetup API is a standard RESTful API allows for authentication through a free API key. Instead of creating my own API wrapper in Python to retrieve the data, I utilized a lot of Meetup’s unmaintained Python API wrapper code. The code was definitely old and needed to be updated to handle python3, pagination, and new endpoints, but it managed to get the job done.
The calls to retrieve the data ended up being as simple as:
m = Meetup() # Meetup API wrapper object
EVENT_KWARGS['no_earlier_than'] = self.start
EVENT_KWARGS['no_later_than'] = self.end

all_groups = m.get_groups(**GROUP_KWARGS) # get_groups hits the API and paginates
                                          # through all groups within a set of filters
with self.db_session() as db:
    for group_obj in all_groups:
      for group in group_obj.results:
          time.sleep(0.4)
          group.get_events(m, **EVENT_KWARGS) # get_events hits the API and paginates
                                              # through all events in a group

      load_groups(all_groups, db, self.start) # load_groups stores all events/groups in the database
                                              # using SQLalchemy functions
If you want to see the rest of code, please refer to the wrapper module and the airflow operator (an Airflow class to run the data retrieval step).
2) Transforming and Loading the data
Now that the Meetup data is stored in a database (using AWS RDS in this case), the next step is to transform the data into a star schema. I used SQLalchemy to create the models and build the tables in Python. The transformations are done in pure sql (executed through SQLalchemy in Airflow) because the data was not very complex or large enough to use a more powerful tool. The sql scripts are straightforward:
- create_date_dim.sql - Generates a table for the date dimension table
- get_last_job_date.sql - Gets the most recent execution date of the data pipeline
- staging.sql - Staging scripts before the tables are loaded into production
- load_data.sql - Load the tables into production
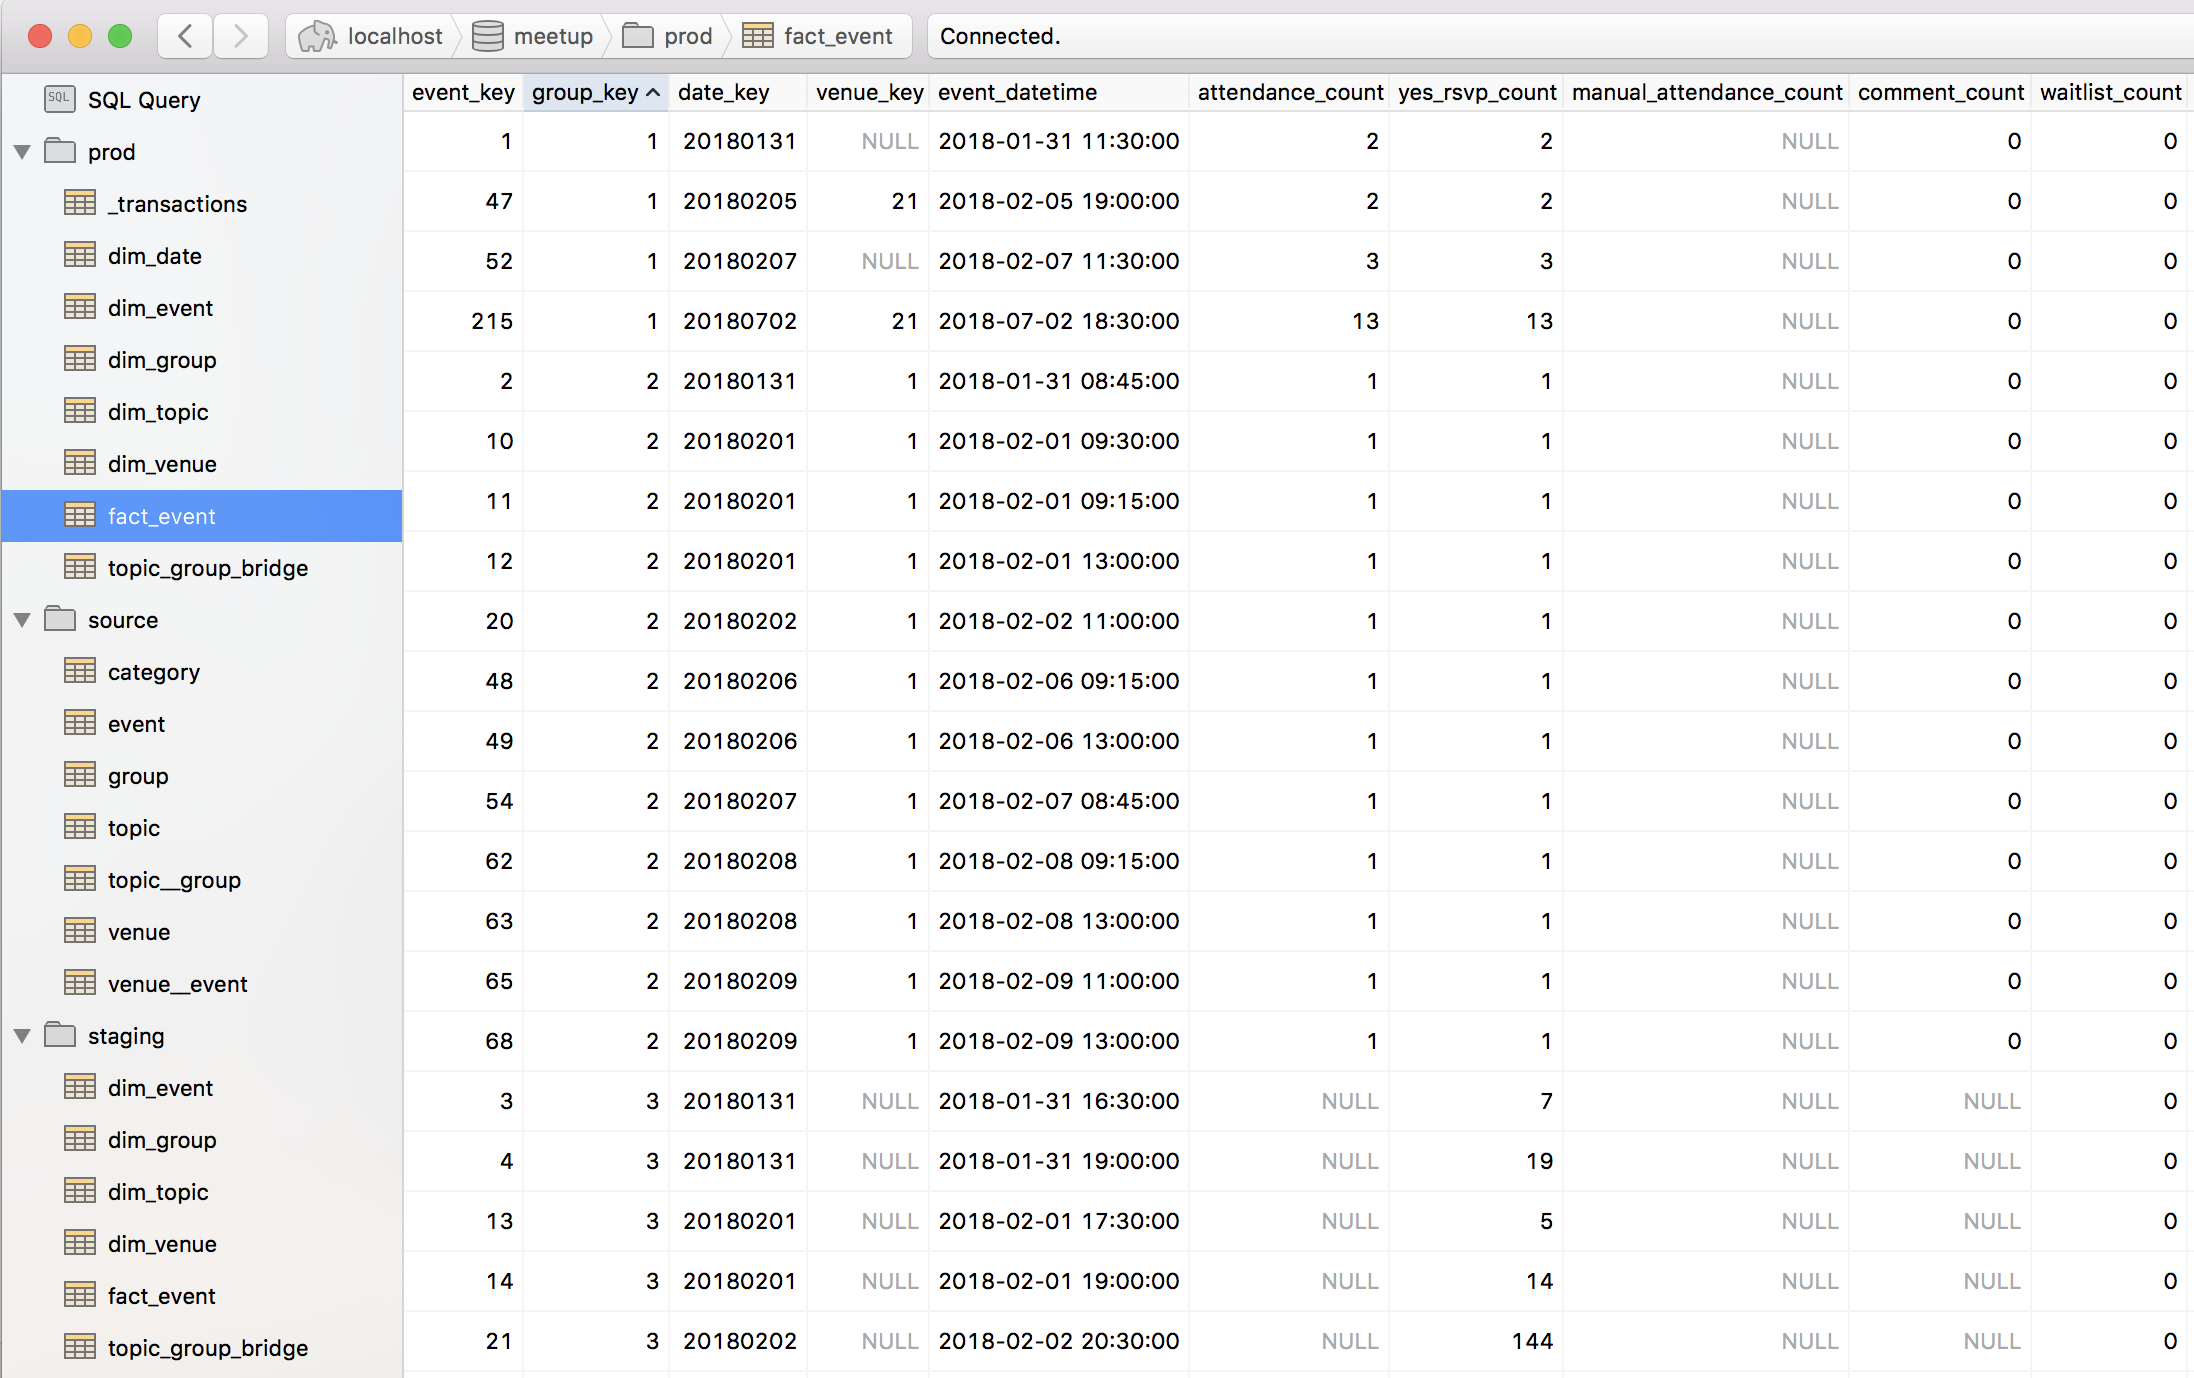
The final schemas and tables in Postico
In the real-world, the transactional data and staging/production data would be in separate databases. I am not entirely sure about best practices when it comes to having the staging and production tables live in the same database, so if anyone has insights into this, it would be great if you commented.
Lastly, I would like to point out that the most complex part of this step was understanding incremental load. For this project, I used batch dates to determine if the data existed in the warehouse or not.
3) Visualizing the data
Finally, the last (and most) fun step: visualizing the data.
If you have not seen the dashboard yet, you can view it here.
I credit Adil Moujahid’s post for showing me dc.js and leaflet which I used in my dashboard. The word cloud was built using Jason Davies’ library.
Since most companies use a 3rd-party software like Tableau instead of D3.js to visualize the data, I will not go into how I coded the charts as it is not essential to know. You can view my .js file here to see how I built the charts.
Conclusion
My original plan was to host the dashboard using a Flask app on a server, but I realized that the financial and work investment needed to do that would be too much for me, so I found github pages to be the perfect solution. While the data is a static CSV, I am still happy I was able to build an entire pipeline robust enough to extract years of data. I hope to start a new project using more powerful tools like Spark, Hadoop, and Tensorflow and implement machine learning models within a pipeline.
If you read this far, I hope you learned something new or were inspired to build something yourself. Feel free to drop a comment if you have any questions, and I will respond when I can. Thanks for reading!